A vulnerability management program should provide a series of metrics that outline the vulnerability risk to the organization and how the risk posture is trending. In addition to this, reports should be provided which show system owners which vulnerabilities pose the greatest risk to the organization and how to remediate them. This report outlines recommendations for vulnerability management reporting based off of industry best practices.
Tripwire Vulnerability Management Overview
Tripwire’s IT security solutions reduce risk, ensure systems and data security, and automate attainment of regulatory compliance objectives. Tripwire offerings solve the security configuration management, vulnerability management, continuous monitoring and incident detection problems facing organizations of all sizes, as stand-alone solutions or in concert with other IT security controls. Ultimately, Tripwire helps detect issues, protect sensitive data and positively connect these values to business objectives.
Tripwire’s mission statement for vulnerability management is to deliver the most complete and accurate coverage for security issues that matter to real enterprise environments. As such, Tripwire provides a tiered architecture to provide scalability and reliability while scanning in production environments including, but not limited to, DMZs and SCADA environments.
Vulnerability Risk Scoring
The risk a vulnerability or set of vulnerabilities poses needs to be objectively calculated to ensure consistency. Vulnerability severity has been calculated in the industry based on the Common Vulnerability Scoring System (CVSS). This scoring system rates vulnerabilities on a bounded range of 1–10. The problem this poses, however, is that in large organizations there are often too many 9s and 10s to remediate within a reasonable time frame. Therefore, additional information is required.
In addition to providing the CVSS scores, Tripwire provides additional information that objectively rates vulnerabilities based on how easy they are exploit, what privilege an attacker would get upon successful remediation, and the age of the vulnerability. Older vulnerabilities pose a higher threat, as they are the ones being more actively exploited in the wild. The Tripwire scoring system plugs these variables into a formula to provide an unbound integer. This allows for easy visibility to the highest risk vulnerabilities, as well as provides an easy way to trend the risk score across the organization over time.
Furthermore, to simplify vulnerability scoring for the business, who are not information security professionals, a simple High/Medium/Low scoring model is required. Therefore, depending on the audience for the vulnerability report, a different scoring system needs to be applied.
Executive Vulnerability Metrics
When working towards the continuous improvement of any process, the first important thing to do is take a baseline set of metrics for the organization. A common mistake made by most organizations is that the first question asked is, “How many vulnerabilities do we have?” or “How many HIGH vulnerabilities do we have?” This metric, while serving a purpose, does not provide a good sense of the overall risk trend of the organization. This metric is typically used when looking at vulnerability risk by CVSS score.
Instead, using the Tripwire risk score the first question we would like to answer is, “What is the overall risk posture of our organization?” This metric provides a starting point for reducing the risk within the organization. While specific numbers are not required at this high level, charting this metric over time allows executives to see whether the risk in the organization is trending higher or if efforts to reduce risk are paying off. Figure 1 shows an example of a Tripwire risk score over time; over the course of the twelve weeks this metric has been tracked the overall risk posture has been relatively steady.

For further details, the same metric can be broken down into the individual management groups within the organization as shown in Figure 2. In this example, the organization is broken down by ownership of the operating system type. However, the groups can be organized based on the needs of each specific organization.
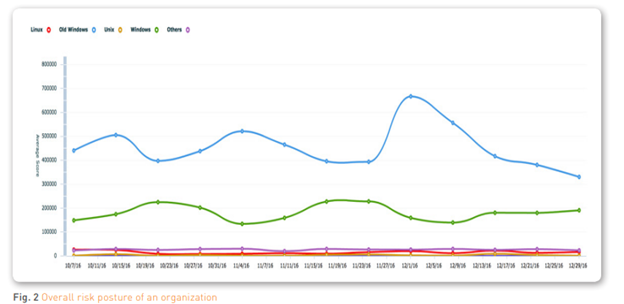
Upon analysis of this graph, we see that the two greatest contributors to the risk of the organization are old Windows operating systems which are no longer supported, as well as our current Windows operating systems. In order to greatly reduce the risk posture of the organization, we can initiate a project to migrate off of the older, unsupported, operating systems.
Furthermore, we see that the vulnerability risk in each of the areas has remained relatively steady. We can set goals to reduce this risk depending on the risk tolerance of the organization, as well as the aggressiveness with which the executives would like to reduce the risk.
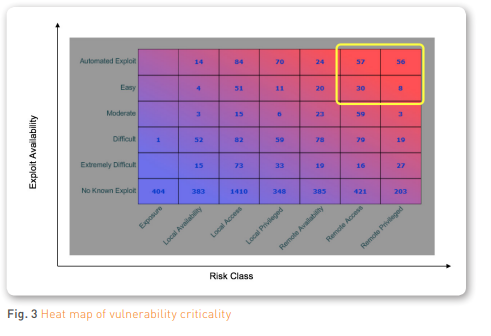
Typically, organizations in the early stages of their vulnerability management program have average Tripwire risk scores well over the 20,000 range. In contrast, very mature organizations are able to keep their risk scores below 5000. In order to get to that level of maturity, most organizations will set risk reduction targets between 10% and 20% year-over-year. This allows their teams to focus both on remediating existing risks as well as keeping up to date with current patch levels as new threats emerge. Now that we have seen how the example organization is trending, let us dive further into the specific metrics that provide a deeper understanding of its current security posture. The first metric (Figure 3) shows a heat map of the criticality of vulnerabilities based on the ease of exploit and privilege an attacker will gain upon successful exploitation of the vulnerability.
The first priority of remediation should be the vulnerabilities in the top-right corner of the matrix as those vulnerabilities pose a risk of an attacker being able to remotely exploit the vulnerability with ›minimal effort. These are “low hanging fruit” that should be immediately addressed. Following that, any vulnerability with an automated exploit should be remediated as minimal effort is required for successful exploitation.
Figure 3 shows the vulnerability numbers across an organization, but can easily be filtered to show the same matrix for only vulnerabilities assigned to a particular owner. Similarly, filters can be applied to only show the results for a particular application. A common metric desired by organizations is to know how many vulnerabilities are present in Java and Adobe applications, as seeen in Figure 4.
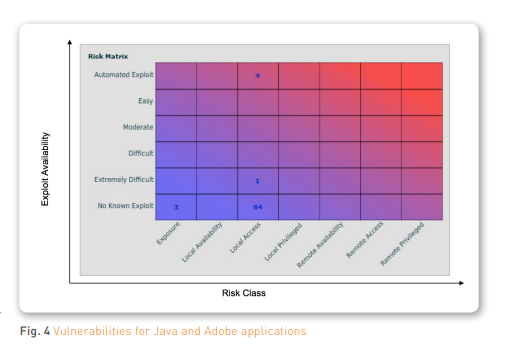
Teams that are typically overwhelmed by remediating hundreds of vulnerabilities, can focus on the ones that will have the greatest impact to the organization. In this example, they can focus on remediating the four vulnerabilities that have automated exploits associated first, before moving into remediating other vulnerabilities.
Some other key metrics to consider are host, vulnerability, and application metrics. Figure 5 shows some out of the box metrics to consider when evaluating a vulnerability management program. It’s also important to identify the trend of hosts and vulnerabilities identified over time. Figure 6 shows the difference between two points in time across the entire organization.
One can see that while there were a high number of vulnerabilities not remediated, there was made progress in remediating 1608 vulnerabilities. These numbers can also be further broken out by department or system owner based on the requirements of each specific organization


Operational Vulnerability Reports
An alarming, yet common, trend among organizations is to run a report that contains all of the vulnerabilities found under a particular system owner and send them a very large report. Some organizations have matured beyond that to provide reports that only include everything that is a “High” score. The main question then becomes, what defines a high-scoring vulnerability? To answer this, security analysts have typically said anything that is a CVSS 7 or above should be remediated. The PCI standard, for example, says that a CVSS score of 7.0–10.0 is High, 4.0–6.9 is Medium, and 0.0–3.9 is Low.
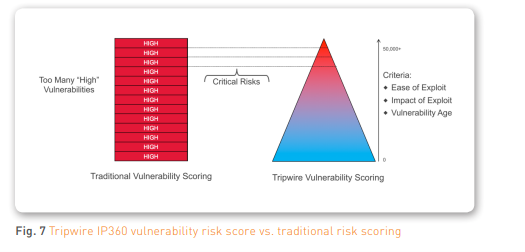
In common practice, system administrators have said that there are far too many vulnerabilities that with a CVSS score of 10 and above to remediate within a reasonable amount of time. Depending on the organization, system administrators have committed to Fig. 7 Tripwire IP360 vulnerability risk score vs. traditional risk scoring Fig. 8 Target per-host report remediating anywhere from one to 10 vulnerabilities per month. So the first question they pose to the security analysts is, “which of these vulnerabilities with a CVSS score of 10 is the most severe?”
The Tripwire vulnerability risk score alleviates this problem. Figure 7 illustrates that by providing the specific details of the ease of exploit, the privilege gained, and the age of the vulnerability, security analysts have a simple, objective answer to provide to system administrators.
In some cases, based off of these factors, a vulnerability that has a CVSS score below 10 might pose more of a risk to the organization than one with a CVSS score of 10. In some cases, system administrators will channel their remediation efforts on either a per-host or per-vulnerability basis. If they choose to remediate per host, Tripwire can provide a report that shows the top 10 most at-risk hosts. See Figure 8 for an example.

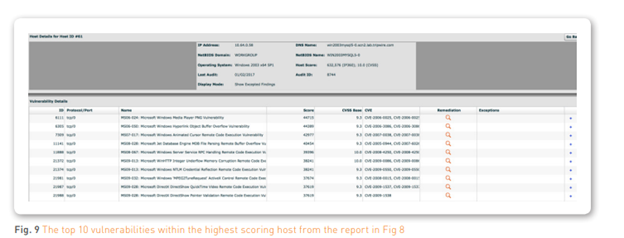
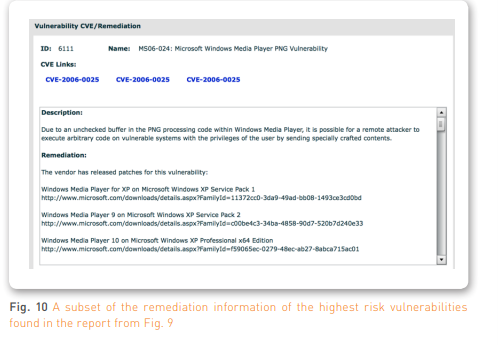
Each one of these hosts can then be investigated further to show the top vulnerabilities, along with their remediation details. Figure 9 is an example of the top 10 vulnerabilities within the highest scoring host from the report example in Figure 8. Figure 10 shows a subset of the remediation information of the highest risk vulnerability within that report.
If the system administrators prefers to channel their remediation efforts on a per-vulnerability basis, we can look at the reports based on the vulnerability risk score to see the 10 most severe vulnerabilities within the organization, as seen in Figure 11.
One of the most common frustrations for information security analysts is false positives in the data. When the data collected can’t be trusted, the system administrators lose confidence in both the analyst and the solution providing the data. While no solution is perfect, Tripwire strives to be as accurate as possible, with a <1% false positive rate.

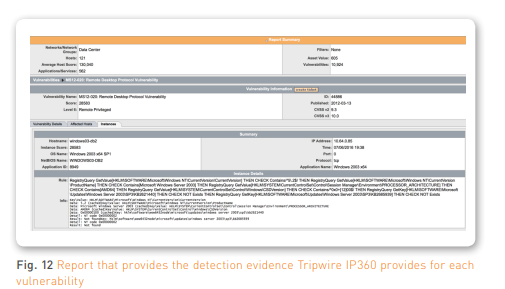
For each vulnerability detected, Tripwire provides detection evidence. In many cases, just because a patch is applied it does not necessarily mean that the vulnerability is remediated. In these cases, sometimes a reboot is required or a vulnerable file needs to be manually removed for complete remediation. Figure 12 is an example of the detection evidence that Tripwire provides for each vulnerability.
Zero-Days and Application Licensing
There are many cases where a zero-day vulnerability is announced and specific vulnerability detection coverage is not available. In these cases, information is provided to show which version(s) of the application(s) are affected.
Using Tripwire reporting, a new scan doesn’t necessarily need to be run to identify which systems are vulnerable.
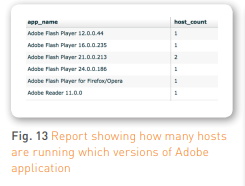
A simple report can be run to show how many of each version of the application is running using the most recent scan data. Figure 13 is report example that shows how many hosts are running which versions of Adobe applications.
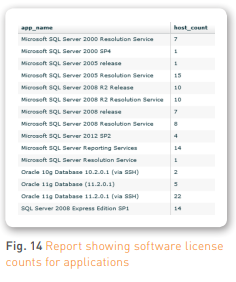
Similarly, this data can be used to determine software license counts for applications (such as database instances) across the organization, as shown in Figure 14.
Conclusion
Vulnerability and risk management is an ongoing process. The most successful programs continuously adapt and are aligned with the risk reduction goals of the cybersecurity program within the organization. The process should be reviewed on a regular basis, and staff should be kept up to date with the latest threats and trends in information security. Ensuring that continuous development is in place for the people, process, and technology will ensure the success of the enterprise vulnerability and risk management program. In the initial stages of building the program it’s not uncommon for an organization to have a very high average vulnerability score and lengthy remediation cycles. The key is to show progress month by month, quarter by quarter, and year by year. The vulnerability risk scores and time to remediation should decrease as teams become more familiar with the process and become more educated on the risks that the attackers pose.